Browse
PhosCancer offers both qualitative (Gene/Protein, Position and Cancer) and quantitative (DE, Stage and Survival) search options, enabling users to input keywords individually or in combination. The term "No Data" indicates that the phosphosite lacks sufficient data for quantitative analysis, as its missing value rate exceeding 80% in the sample set. Details are as follows:
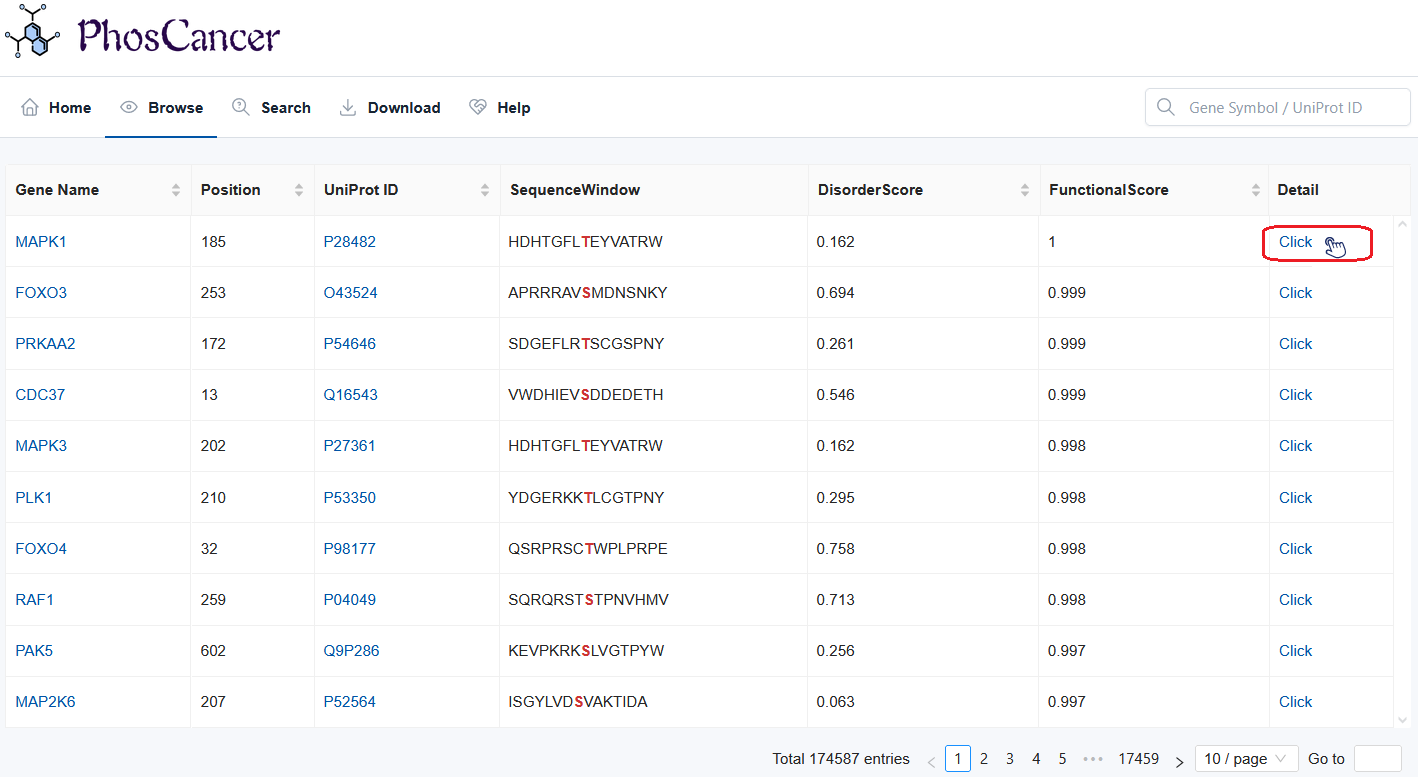
- Browse table: The browse table comprises 7 columns and details are as follows:
- Gene Name: The gene name where the phosphosite is located. By clicking on the gene name, users can enter GeneCard to view detailed information.
- Position: The position of the phosphosite.
- UniProt ID: The protein ID where the phosphosite is located. By clicking on the protein, users can enter UniProt to view detailed information.
- SequenceWindow: Sequences surrounding the phosphosite (+/- 7 AAs).
- Disorder Score: Intrinsic disordered probability score is derived from the IUPred3 and a residue with a disorder probability above 0.5 is considered as disordered.
- Functional Score: The phosphosite functional score is derived from funscoR (Nature biotechnology, 2020, 38(3): 365-373).
- Detail: By clicking on the protein, users can enter to a detail view of the phosphosite.
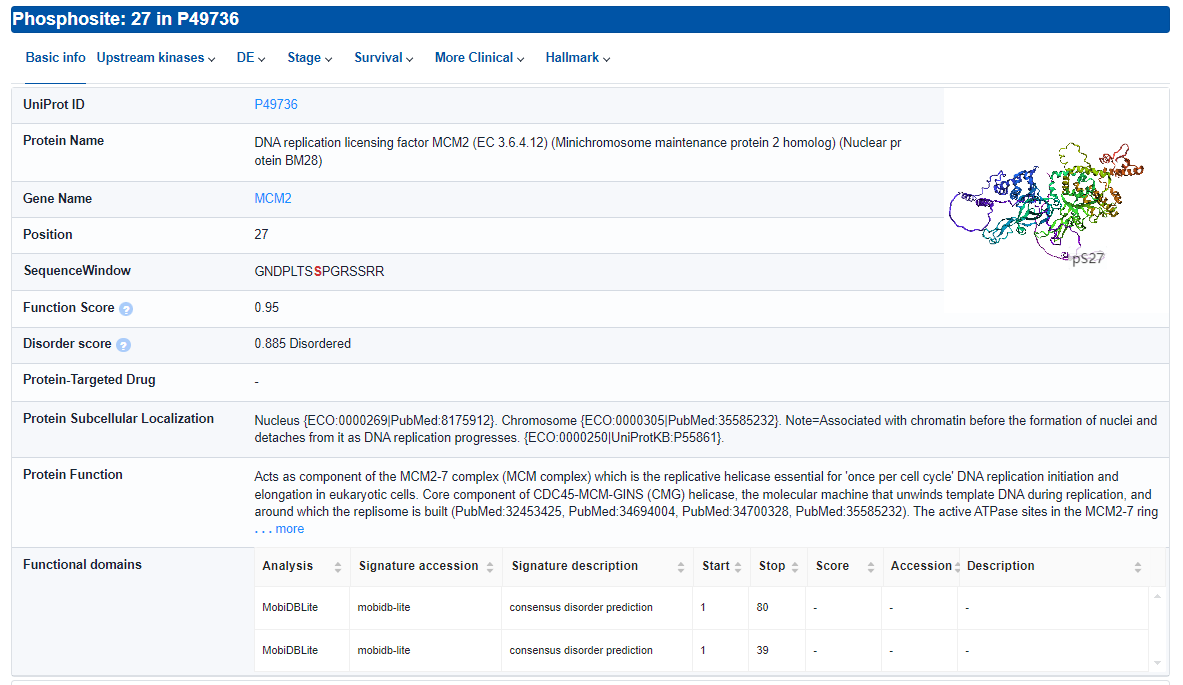
- Basic info: Basic information about the phosphosite.
- Protein-Targeted Drug: Drugs targeting the protein where the phosphosite is located, according to DGIdb, DrugBank and Therapeutic Target Database.
- Functional domains: Protein domains where the phosphosite is located, according to the InterPro. Click for Output formats.
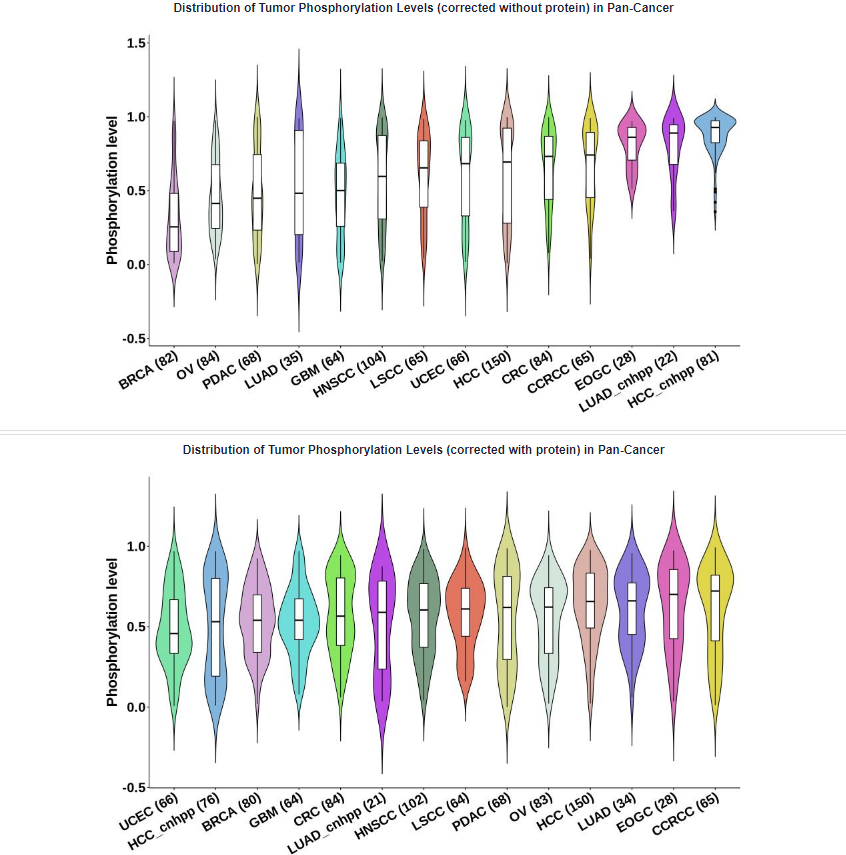
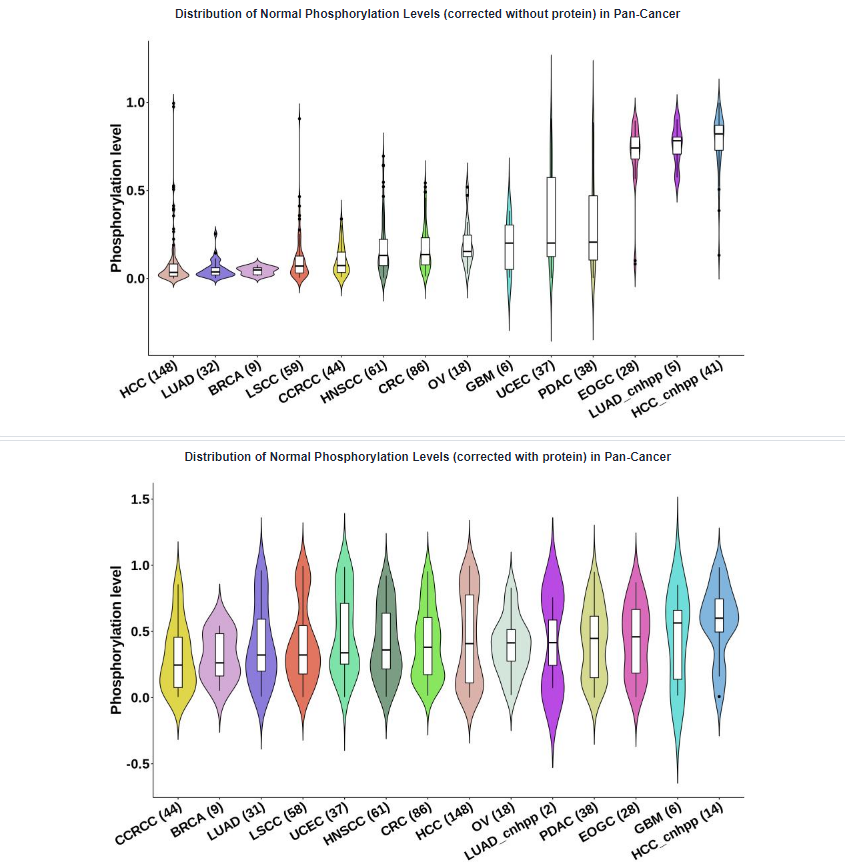
- Plots: Distribution of phosphorylation levels in Pan-Cancer. The absence of samples for certain types of cancer in the figures can be attributed to the lack of non-missing value samples at this specific phosphosite within the corresponding cancer type.
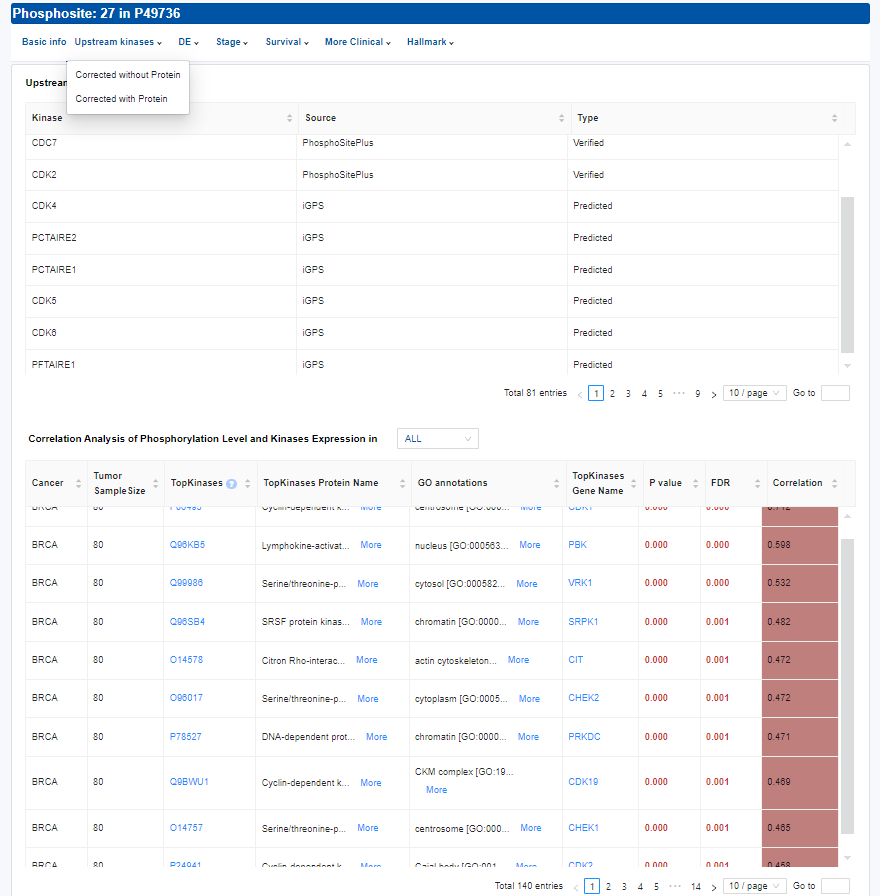
- Upstream kinases: Kinase–phosphosite associations.
- Upstream kinases: The phosphosites upstream kinases have been established through verification from phosphoELM and PhosphoSitePlus, and prediction by GPS and iGPS with high thresholds and Johnson et al. Kinases that ranked within the top 10 for the Ser/Thr kinases were considered as biochemically predicted according to Johnson et al.
- Correlation Analysis of Phosphorylation Level and Kinases Expression in Cancer: TopKinases is identified as the top 10 kinases with the highest absolute correlation coefficient among those for which the correlation p-value is less than 0.05.
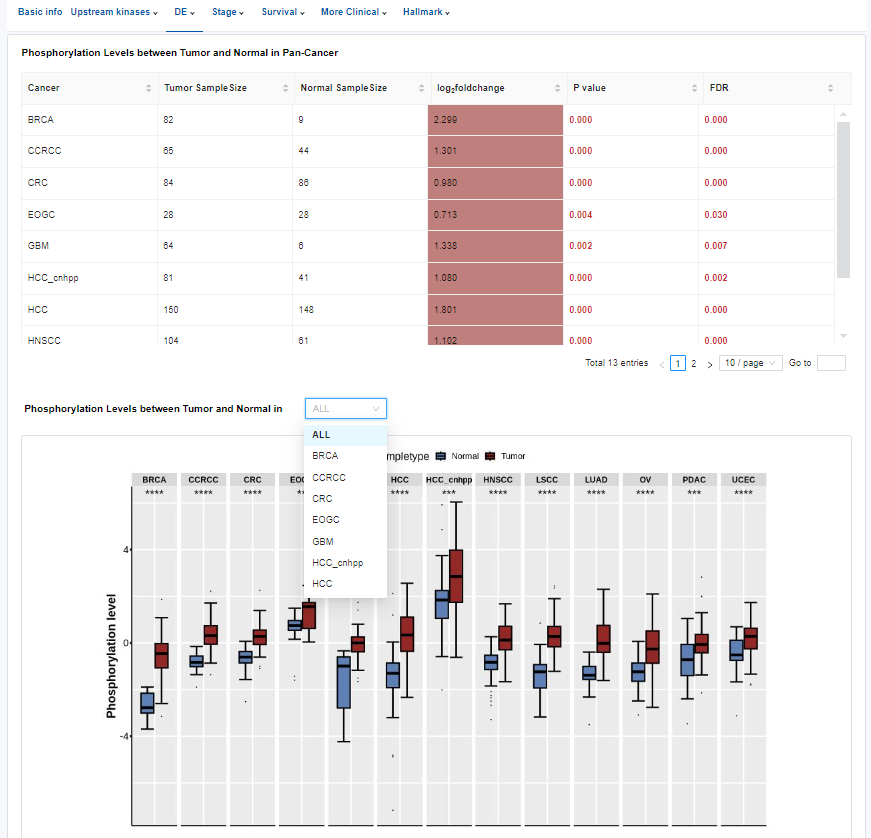
- DE: Differential analysis between tumor and normal.
- Table: Differential analysis result of the phosphosite between tumor and normal.
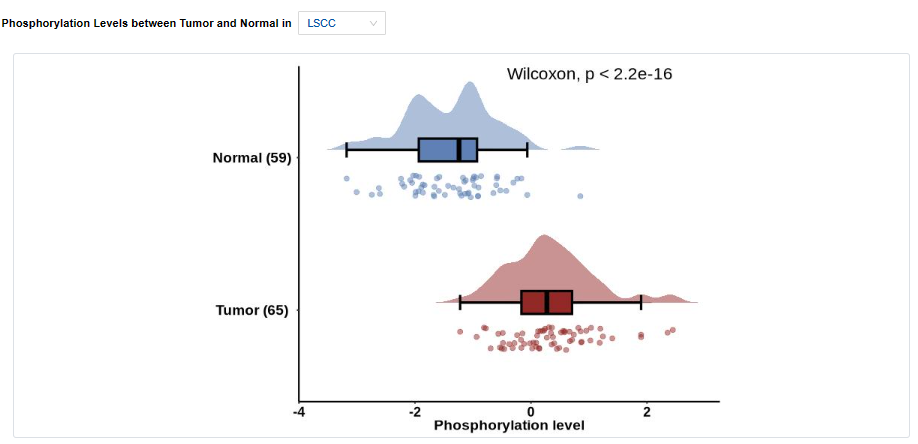
- Plots: Phosphorylation levels between tumor and normal in Pan-Cancer or specific cancer types. Click to access additional options for specific types of cancer.
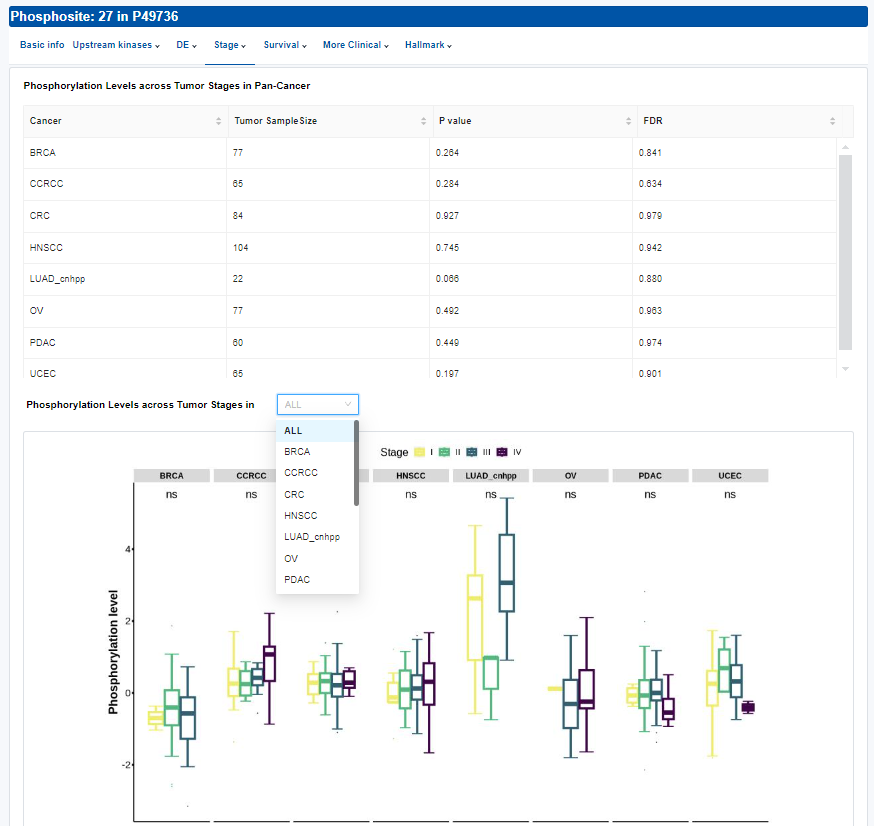
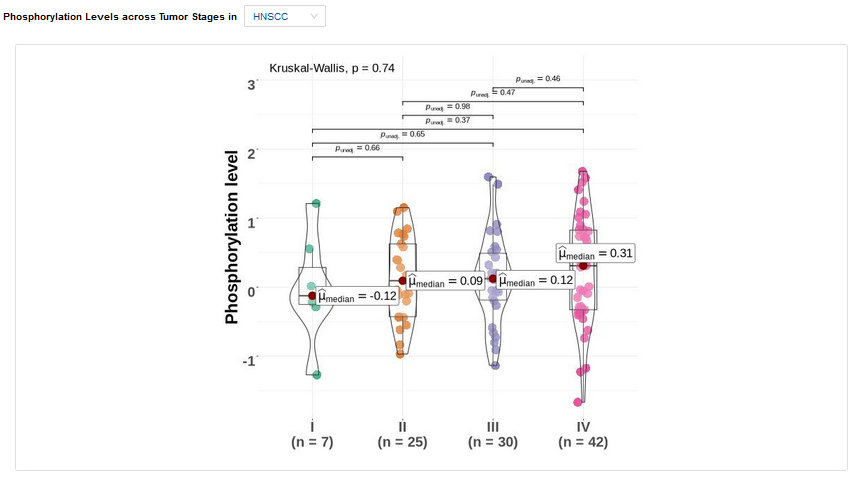
- Stage:Differential analysis across tumor stages.
- Table: Differential analysis result of phosphorylation levels across tumor stages.
- Plots: Phosphorylation levels across tumor stages. Click to access additional options for specific types of cancer.
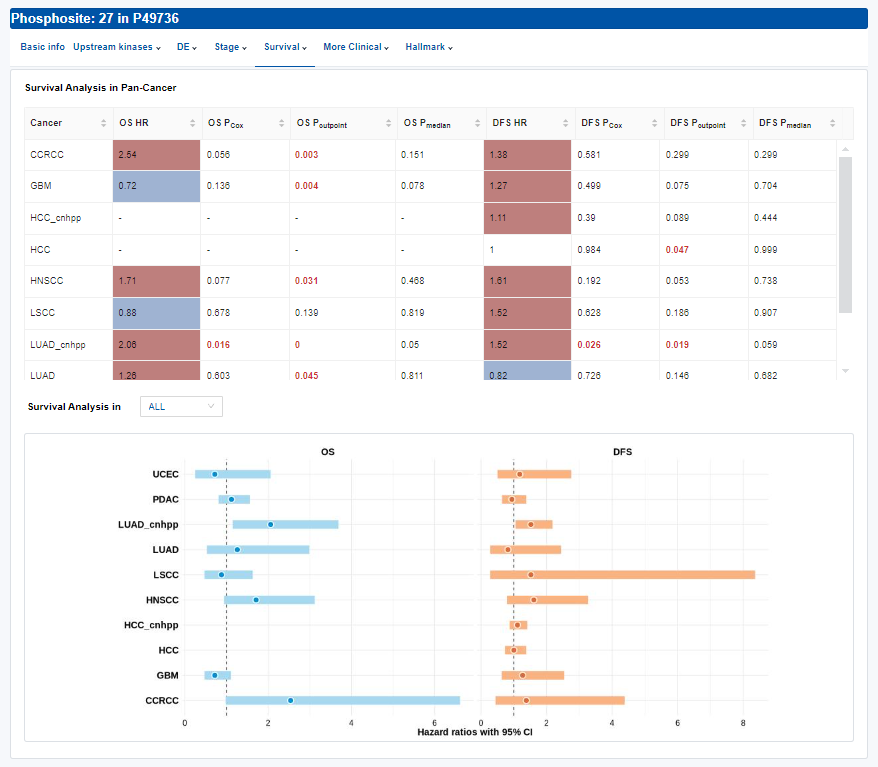
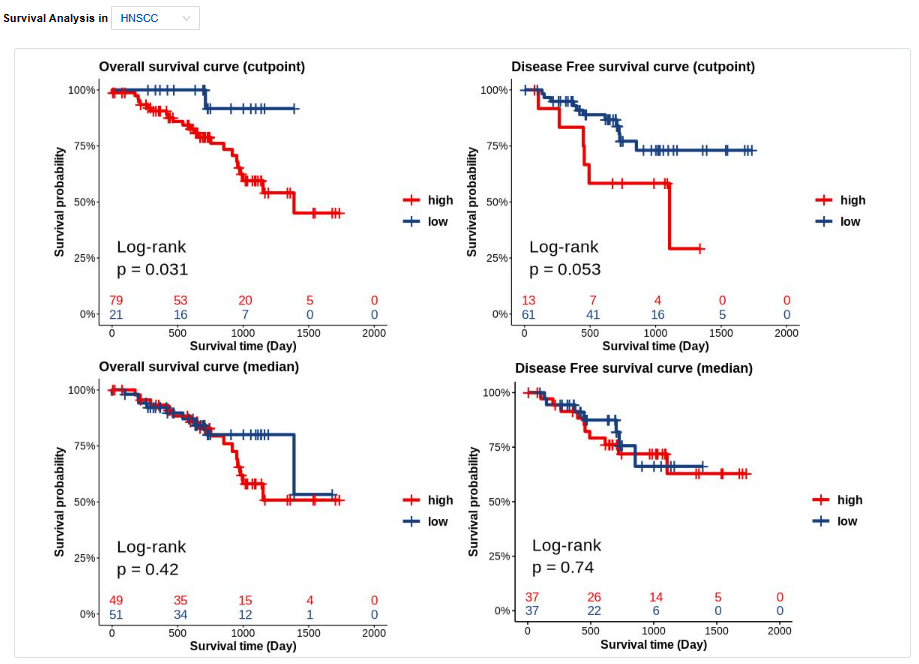
- Survival: Survival analysis.
- Table: Overall and disease-free survival analysis result.
- Plots: The forest plot of hazard ratio is used for Pan-Cancer and Kaplan-Meier curves are used for single cancer type. Click to access additional options for specific types of cancer.
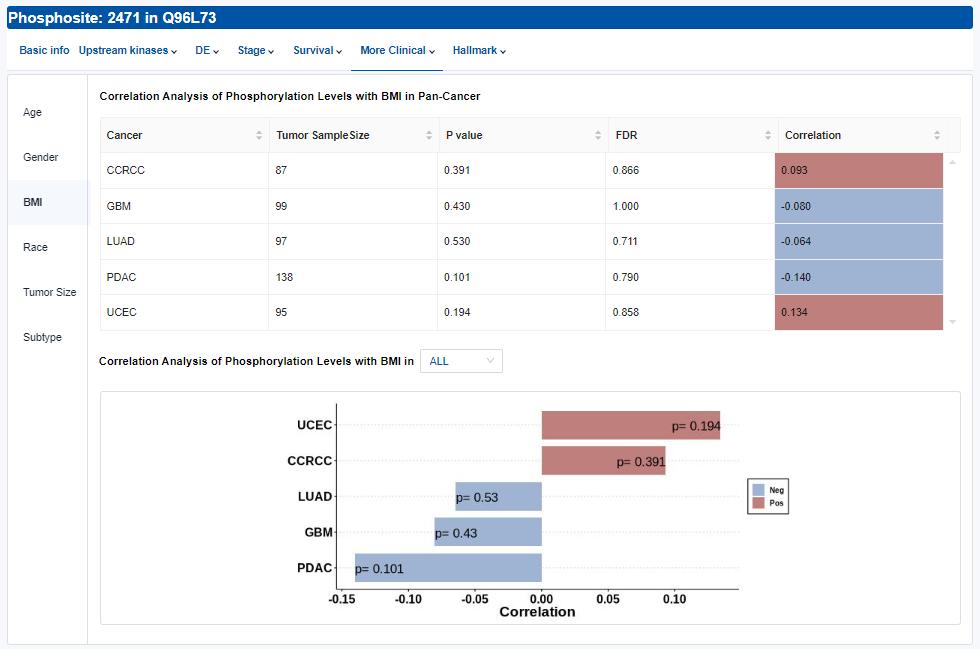
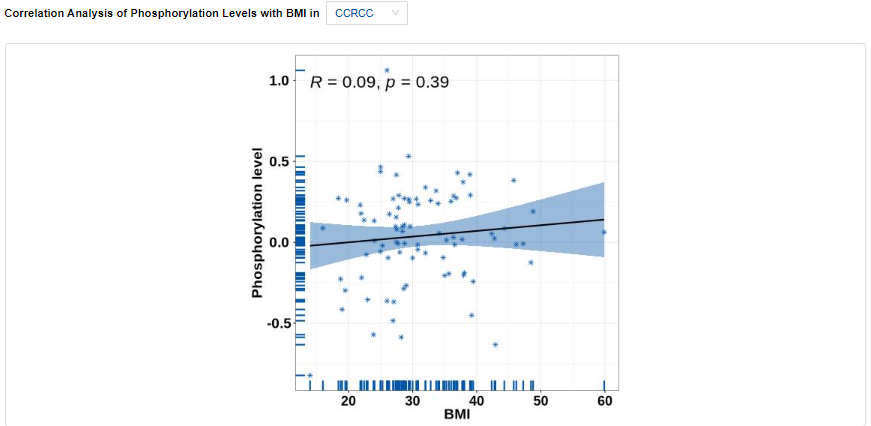
- More Clinical: Association analyses include age, gender, BMI, race, tumor size and major subtypes within the corresponding cancer type.
- Table: The tables for age and gender are similar to those in the DE section. The tables for BMI and tumor size are similar to those in the Hallmark section (see below). The tables for race and major subtypes are similar to those in the Stage section.
- Plots: Phosphorylation levels across different clinical features. Click to access additional options for specific types of cancer.
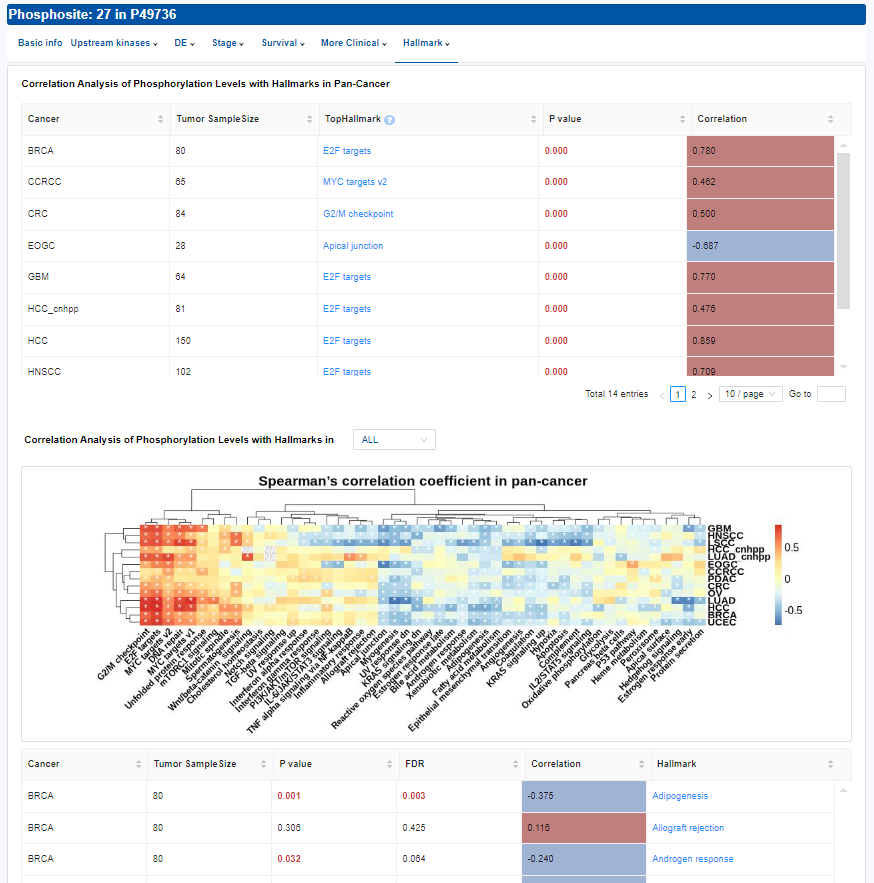
- Hallmark: Correlation analysis result of phosphorylation levels with hallmarks.
- Table: Spearman's correlation analysis between phosphorylation levels and the activities of top hallmark-based protein expression, using the ssGSEA method.
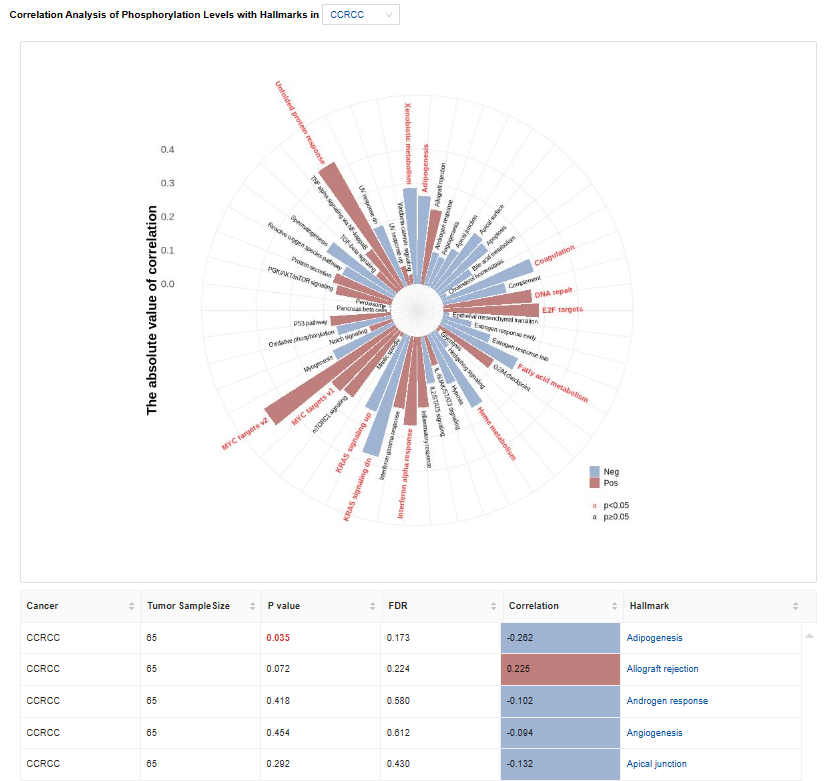
- Plots: The heatmap of correlation coefficients is used for Pan-Cancer and bar charts are used for single cancer type. Click to access additional options for specific types of cancer.
- Table: Spearman's correlation analysis between phosphorylation levels and the activities of total hallmark. Click to access additional options for specific types of cancer.
| Column | Description |
|---|---|
| Cancer | Cancer type |
| TumorSampleSize | The number of tumor samples with non-missing values |
| NormalSampleSize | The number of normal samples with non-missing values |
| log2foldchange | log2fold change (Tumor/Normal) |
| P value | P value from Wilcoxon test |
| FDR | FDR for p value from Wilcoxon test |
| Column | Description |
|---|---|
| Cancer | Cancer type |
| TumorSampleSize | The number of tumor samples with non-missing values |
| P value | P value from Kruskal-Wallis test |
| FDR | FDR for p value from Kruskal-Wallis test |
| Column | Description |
|---|---|
| Cancer | Cancer type |
| OS HR | Hazard ratio for overall survival |
| OS PCox | P value from Cox regression analysis for overall survival |
| OS Pcutpoint | P value from the log-rank test using an optimal cutpoint for overall survival |
| OS Pmedian | P value from the log-rank test using a median cutoff for overall survival |
| DFS HR | Hazard ratio for disease-free survival |
| DFS PCox | P value from Cox regression analysis for disease-free survival |
| DFS Pcutpoint | P value from the log-rank test using an optimal cutpoint for disease-free survival |
| DFS Pmedian | P value from the log-rank test using a median cutoff for disease-free survival |
| Column | Description |
|---|---|
| Cancer | Cancer type |
| TumorSampleSize | The number of tumor samples with non-missing values |
| TopHallmark | TopHallmark is identified as the top kinase with the highest absolute correlation value among those for which the correlation p-value is less than 0.05. By clicking on the hallmark name, users can enter the Molecular Signatures Database (MSigDB) to view detailed information. For better visual understanding, the hallmarks have been renamed, and here is the mapping table. |
| P value | P value from Spearman's correlation analysis |
| Correlation | Correlation coefficient from Spearman's correlation analysis |
Copyright © Jing Li's group, SJTU. All rights reserved.