Search
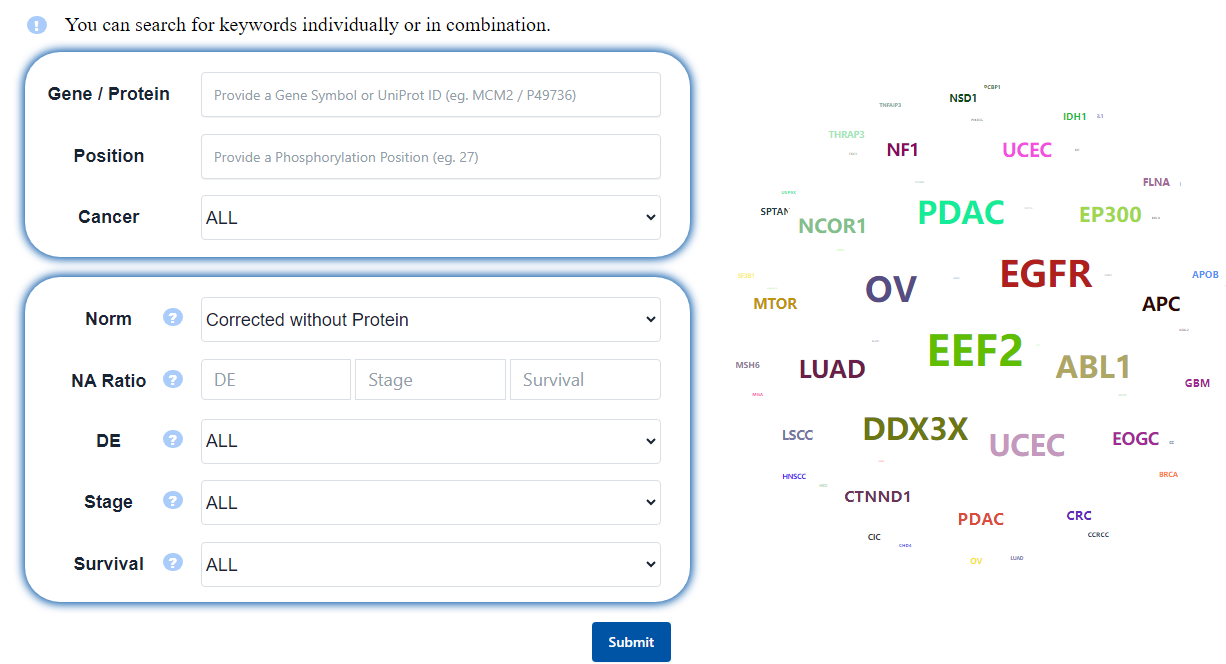
PhosCancer offers both qualitative (Gene/Protein, Position and Cancer) and quantitative (Differential, Stage and Survival) search options, enabling users to input keywords individually or in combination. Details are as follows:
- Gene / Protein: Gene symbol or UniProt ID.
- Position: The position of the phosphosite.
- Cancer: The default threshold is ALL. Options includes
ALL
BRCA (Breast Invasive Carcinoma)
CCRCC (Clear Cell Renal Cell Carcinoma)
CRC (Colorectal cancer)
EOGC (Early Onset Gastric Cancer)
GBM (Glioblastoma)
HCC (Hepatocellular Carcinoma)
HNSCC (Head and Neck Squamous Cell Carcinoma)
LSCC (Lung Squamous Cell Carcinoma)
LUAD (Lung Adenocarcinoma)
OV (Ovarian Serous Cystadenocarcinoma)
PDAC (Pancreatic Ductal Adenocarcinoma)
UCEC (Uterine Corpus Endometrial Carcinoma).
- Norm: Normalization of phosphorylation. Options includes
Corrected without Protein
Corrected with Protein
. Data normalization by performing an ordinary least squares fit for each matched protein and PTM site aligned by accession number (R function lm, PTM ~ protein). The residuals from this fit represent the "corrected" phosphoproteome values. - NA ratio: The maximum missing value ratio for analyses allows users to customize the missing value threshold according to their preferences. Users can set the threshold by entering a number between 0 and 0.8 for the three main analyses, including
DE
Stage
Survival
. - DE: Significance filtering of the phosphosites differential analysis between tumor and normal. The default threshold is ALL. Options includes
ALL
p < 0.05
p < 0.01
FDR < 0.05
FDR < 0.01
. The association analysis was conducted using the Wilcoxon test. - Stage: Significance filtering of the association analysis between phosphosites and stage. The default threshold is ALL. Options includes
ALL
p < 0.05
p < 0.01
FDR < 0.05
FDR < 0.01
. The association analysis was conducted using the Kruskal-Wallis test. - Survival: Significance filtering of the association analysis between phosphosites and survival. The default threshold is ALL. Options includes
ALL
OS median p < 0.05
OS median p < 0.01
OS cutoff p < 0.05
OS cutoff p < 0.01
DFS median p < 0.05
DFS median p < 0.01
DFS cutoff p < 0.05
DFS cutoff p < 0.01
. 'median p' is p value from the log-rank test using a median cutoff for overall survival (OS) and disease-free survival (DFS). 'cutoff p' is p value from the log-rank test using an optimal cutpoint for overall survival (OS) and disease-free survival (DFS). - The dynamic word: The word cloud includes 12 cancer names and 38 gene names (these genes are identified as cancer driver genes in a study published in Cell, 2018, 173(2): 371-385. e18. and have at least one phosphosite signaficantly related to clinical features). Users can directly search by clicking on the words, and the speed will slow down when the mouse hovers over the word cloud to facilitate better selection by the users.
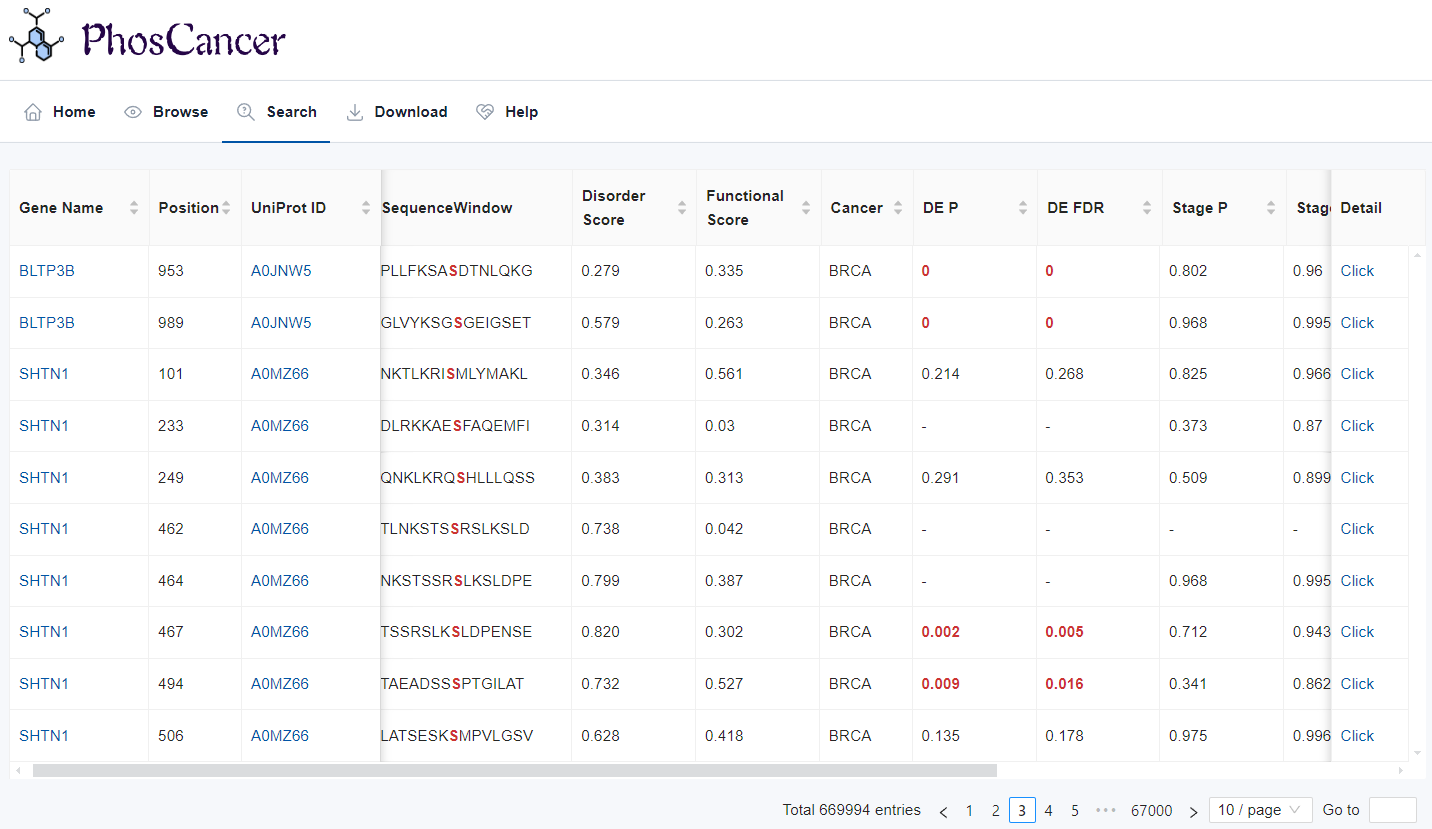
- Search result: The search result table comprises 16 columns and details are as follows:
- Gene Name: The gene name where the phosphosite is located. By clicking on the gene name, users can enter GeneCard to view detailed information.
- Position: The position of the phosphorylated residue.
- UniProt ID: The protein ID where the phosphosite is located. By clicking on the protein, users can enter UniProt to view detailed information.
- SequenceWindow: Sequences surrounding the phosphosite (+/- 7 AAs).
- Disorder Score: Intrinsic disordered probability score is derived from the IUPred3 and a residue with a disorder probability above 0.5 is considered as disordered.
- Functional Score: The phosphosite functional score is derived from funscoR (Nature biotechnology, 2020, 38(3): 365-373).
- Cancer: Cancer type.
- DE P: P value from Wilcoxon test for differential analysis of phosphorylation levels between tumor and normal.
- DE FDR: FDR from Wilcoxon test for differential analysis of phosphorylation levels between tumor and normal.
- Stage P: P value from Kruskal-Wallis test for differential analysis of phosphorylation levels across tumor stages.
- Stage FDR: FDR from Kruskal-Wallis test for differential analysis of phosphorylation levels across tumor stages.
- OS Pcutpoint: P value from the log-rank test using an optimal cutpoint for overall survival.
- OS Pmedian: P value from the log-rank test using a median cutoff for overall survival.
- DFS Pcutpoint: P value from the log-rank test using an optimal cutpoint for disease-free survival.
- DFS Pmedian: P value from the log-rank test using a median cutoff for disease-free survival.
- Detail: By clicking on the protein, users can enter UniProt to view detailed information about the phosphosite. Click for detailed instructions.
Copyright © Jing Li's group, SJTU. All rights reserved.